By Pamela Pali, Bernice Limo, Godfrey Taulya, Ivan Adolwa, Derrick Komwangi, Thomas Oberthür, Amon Natushemba, Sam Webb, Salah Eddine Lahamdi, Nicodemus Bamuhangaine, and James Mutegi
Coffee–banana systems are central to rural livelihoods in southwestern Uganda but vary widely in resource endowment and livelihood strategies. Using baseline data from 470 households in Mitooma and Ntungamo districts, farm typologies were developed based on household assets and income sources. Three farm types emerged: coffee-dependent smallholders, entrepreneurial diversifiers, and livestock-oriented asset-rich farmers. Coffee remained the dominant income source, while diversification through banana, livestock, and other enterprises contributed to household resilience. The findings highlight the need for typology-specific extension, nutrient management, and development interventions to improve productivity, resilience, and sustainability in coffee-based farming systems.
Coffee is one of Uganda’s most important traditional cash crops. Currently, and estimated 1.7 million (M) farmers cultivate coffee in the country. Coffee production has increased by 308% over the last 62 years (1961–2023) (FAOSTAT, 2026). In 2017, coffee contributed approximately 19.1% to the country’s total exports, dominated by Robusta and Arabica, which are grown at an approximate ratio of 4:1 (ICO and UCDA, 2022). Notably, Uganda accounts for most of Africa’s robusta output and is the fourth largest producer in the world, after Vietnam, Brazil, and Indonesia (Davis et al., 2023), and accounts for 7% of global Robusta exports (Kiwuka et al., 2021). Despite its extensive cultivation and export significance, average yields remain low, at approximately 500 kg/ha (ICO and UCDA, 2022), against a yield potential of >1.5t/ha. This yield gap contributes to the current annual production of 8 M 60-kg bags, falling 60% short of the 20 M bag export target set in Uganda’s Coffee 2030 roadmap.
In Uganda, coffee is produced within heterogeneous agroecosystems. Smallholders dominate the production of coffee and bananas, which are often intercropped because of limited land resources (Jassogne et al., 2013). In central Uganda, the socioeconomic benefits of farm diversification strategies and intensified diversification in coffee-banana systems include income and food security, and women are more likely to diversify by including goats and legumes in their coffee-banana systems (Mpiira et al., 2023). Although half of south-western Uganda’s coffee farmers still practice monocropping, the mutual benefits of coffee–banana intercropping systems have been reported. The Marginal Rate of Return (MRR) of adding banana to mono-cropped coffee was 911% and 200% in Arabica and Robusta systems, respectively. Coffee-banana intercropping showed banana yields of 20.19 t/ha/yr in intercrops vs. 14.82 t/ha/yr in monocrops (Arabica region) in the southwestern Ugandan districts of Masaka, Bushenyi, and Rakai (Van Asten et al., 2011).
However, soils are being depleted based on the current crop management practices within coffee-banana systems. For example, according to De Bauw et al. (2016), soil depletion on the slopes of Mount Elgon in eastern Uganda was caused by a lack of adequate nutrient replenishment as coffee has a high nutrient extraction rate under subsistence agricultural systems due to limited fertilizer application. Poor soil fertility is widely reported as a key limitation to the sustainability of coffee– banana cropping systems, where declining nutrient status, competition for resources, and inadequate management practices interact to reduce productivity and long-term system performance (Jassogne et al. 2013). Mukasa et al. (2025) recently characterized the adoption of recommended agronomic practices as low in coffee–banana systems. This impairs the sustainability of coffee cropping systems owing to the low productivity of coffee.
Diversifying coffee cropping systems can enhance the sustainability and resilience of smallholder farmers (Poncet et al., 2024). The “Uganda Carbon Coffee Project (UCCP)” funded by the African Plant Nutrition Institute (APNI) and OCP Foundation, aims to improve the livelihoods and climate resilience of smallholder producers in the coffee-producing landscapes of south-western Uganda. In this project, stakeholders use incentive-based approaches to address productivity and land degradation and improve livelihoods by rewarding sustainable land management and coffee-system diversification. Therefore, diversification is a key aspect of UCCP. Target stakeholders in the project are the Ankole Coffee Producers Cooperative Union (ACPCU), whose membership of 20,000 farmers produce coffee as a cash crop in the region; the Environmental Conservation Trust of Uganda (ECOTRUST), Producers Direct, Makerere University, and Université Mohammed VI Polytechnique (UM6P).
Linking farm types to sustainable livelihoods
The complexity of farming systems is simplified by categorizing farms into homogeneous groups or farm types (Alvarez et al., 2018). They identify patterns in heterogeneous structures and processes that determine the impact of agricultural policy incentives (Huber et al., 2024). The study uses the Sustainable Livelihood Framework and farm typology analysis to understand heterogeneity in asset endowments and livelihood strategies, and diversification theory to explain risk management choices, resilience, and farmer performance outcomes (Fig. 1). Under the farm typology setting, farmers with stronger household assets tend to adopt diversified livelihood portfolios and achieve better performance outcomes, including higher income, greater resilience, and higher farmer adoption rates.
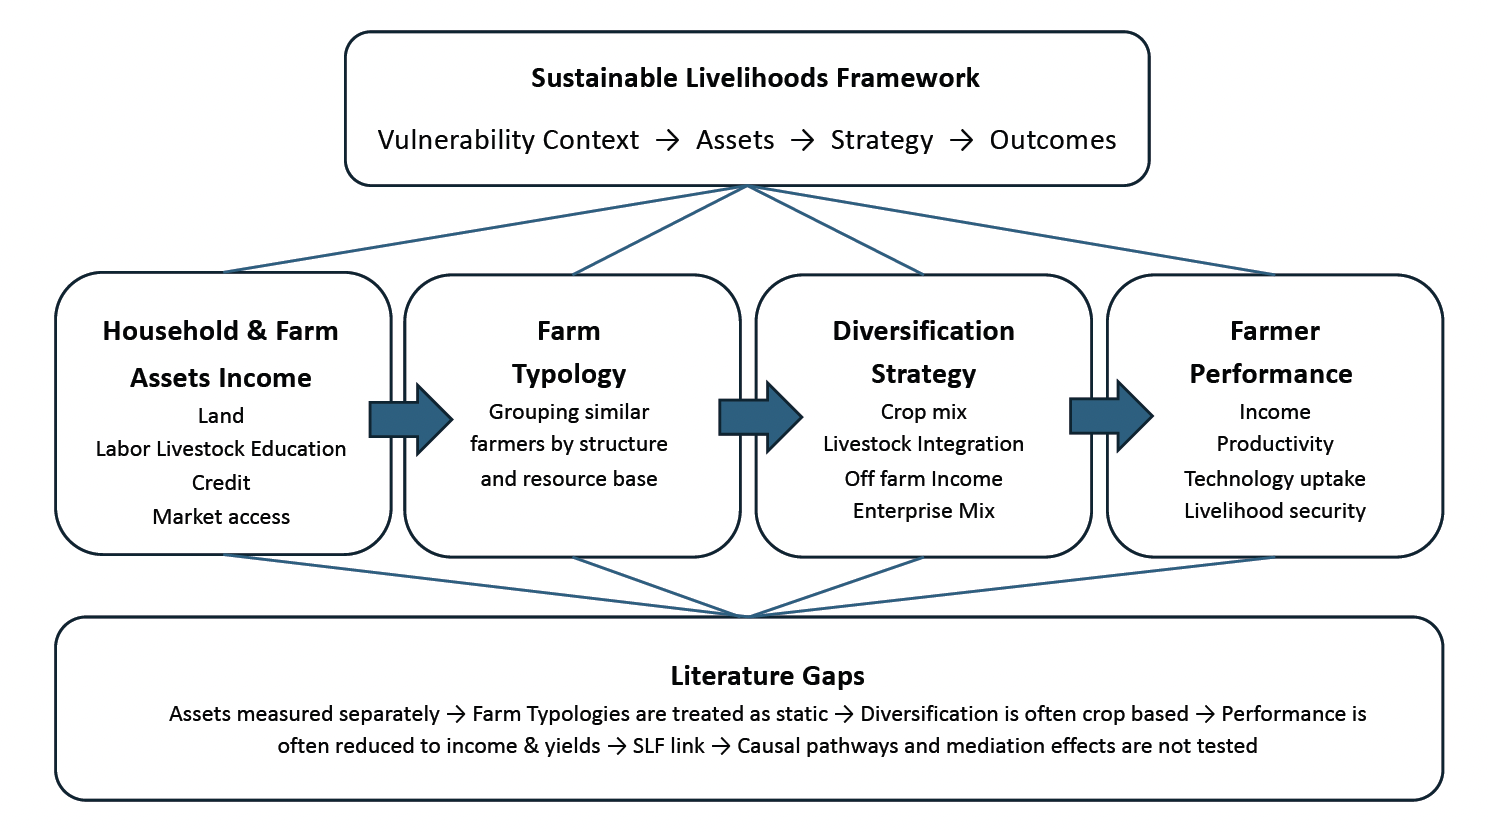
The literature gaps in the endowment-farmer typology-diversification-farmer performance nexus include causality, dynamics, and measurement gaps (Fig. 1). The associated literature primarily classifies farm typologies and lists diversification activities (Apanovich and Nyairo, 2025), while others outline the methodological framework for typology construction, that is, ‘hypothesis-based typology construction’ (Alvarez et al., 2018). However, fewer typologies are connected to a clear causal pathway from assets to strategy to performance over time. Farm typology literature is often described based on one-time surveys (Landais, 1998), hence presenting a cross-sectional bias in the results.
Typologies are usually reported in a static manner, by classifying them as fixed categories which do not consider the dynamic nature of households that can evolve through specialization, diversification, or even through the de-accumulation of assets. This study addresses the literature gap by providing an understanding of “how farm typologies differ in livelihood strategies within coffee banana production systems and which variables explain the greatest heterogeneity across typologies” as a prerequisite to providing insights on diversification strategies and ultimately farmer performance.
Methodology
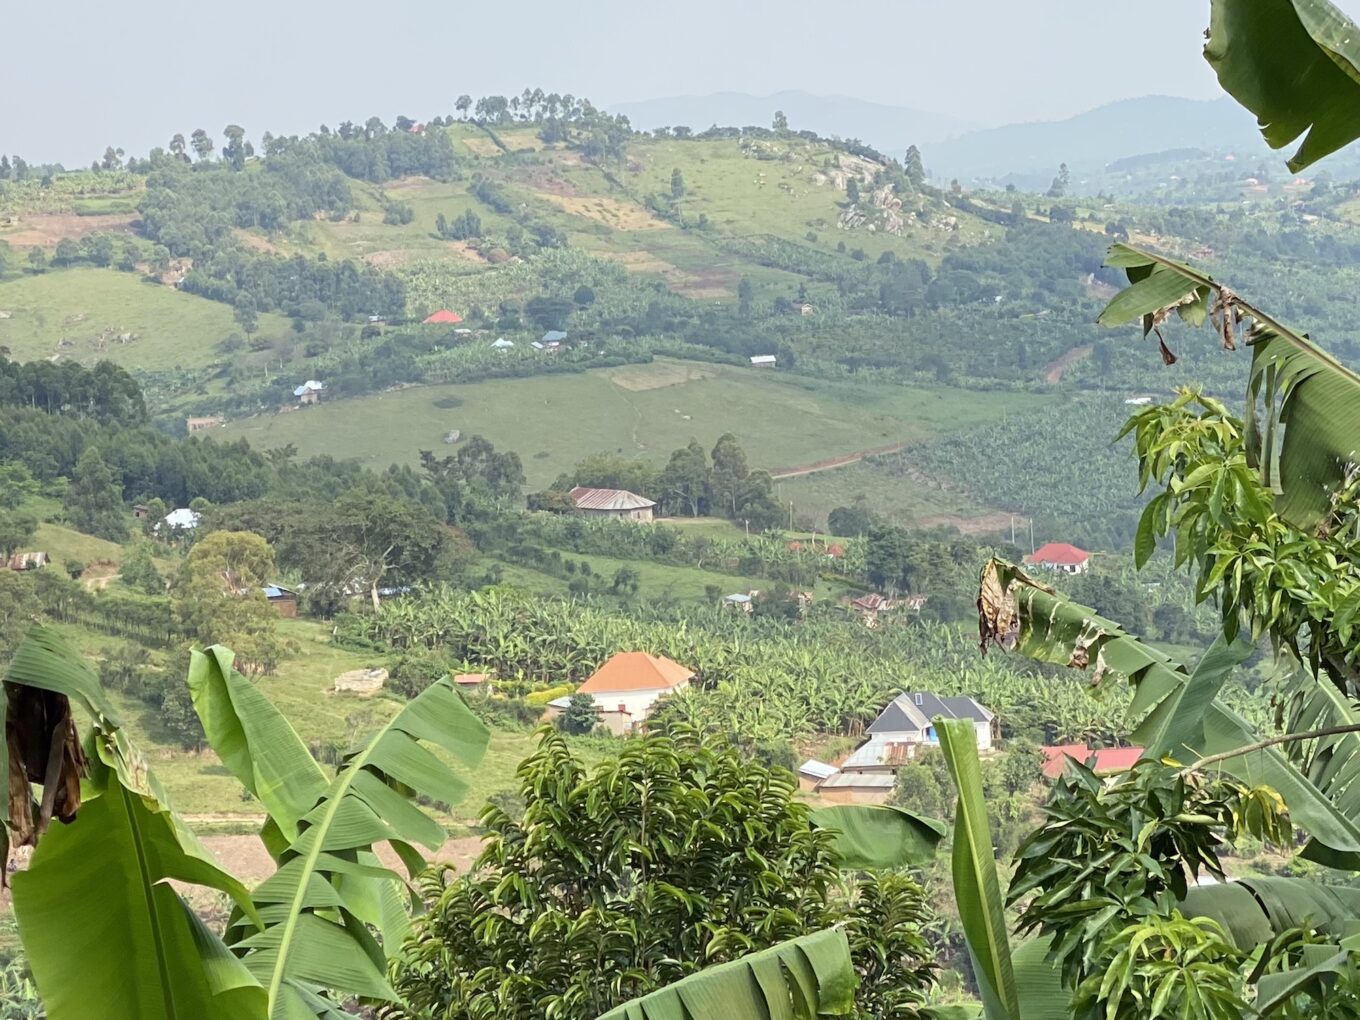
A household baseline survey was conducted between September and November 2023 in the coffee–banana production systems of the Mitooma and Ntungamo districts. Both districts are located in the Ankole region of Uganda and practice integrated crop livestock systems. Almost triple (40,000) the households in Ntungamo grew coffee compared to the approximately 14,000 households in Mitooma. In Mitooma, approximately 20,808 (52.3%) and 25,791 (64.8%) households grow bananas and keep livestock, respectively (UBOS, 2017). Ntungamo is a drier, semi-arid corridor with two pronounced dry seasons. It comprises the coffee–staple–livestock system under strong climate stress and moving toward irrigated intensification, whereas Mitooma has a higher altitude, with cooler and wetter highlands, characterized by a banana–coffee–dairy system with more stable perennials and slightly more diversified cash crops. Mitooma also faces challenges such as drought, hailstones, pests and diseases. The tree systems in Ntungamo are characterized by a drying savannah landscape with limited, fragmented tree cover and strong climate-driven stress, whereas those in Mitooma reflect a highland, more humid environment with structurally richer vegetation (grasslands–woodlands–forests–wetlands).
From a sampling frame of 500 identified households, 470 farmers were randomly selected and interviewed for this study. All respondents were members of societies affiliated with the Ankole Coffee Producers Cooperative Union (ACPCU). The survey was designed to characterize the agroecosystem as an entry point for the Uganda Coffee Carbon Project (UCCP), focusing on household assets, income sources, and prevailing agronomic practices. Informed consent was obtained from each participant prior to the interview, and data were collected using the KoBo Toolbox.
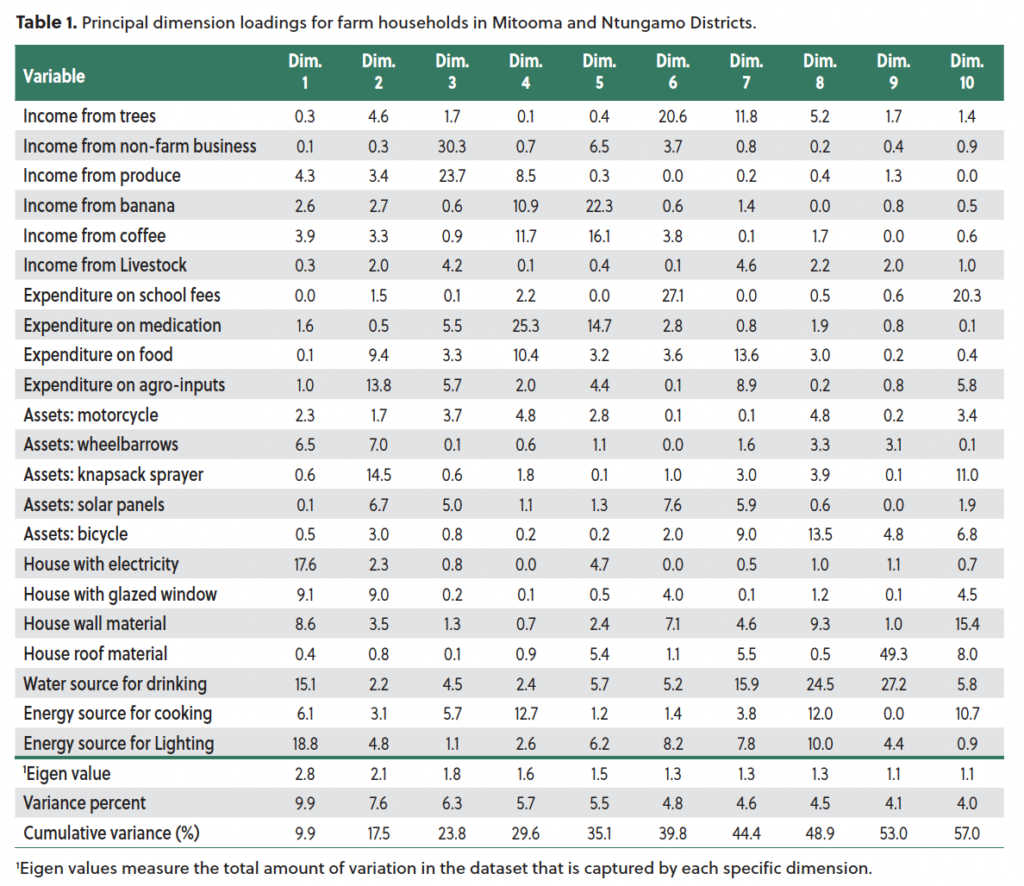
The collected data were analyzed to characterize the farming system and derive farm types. To classify the farm households across Ntungamo and Mitooma districts into distinct farm types, a Factor Analysis of Mixed Data (FAMD) combined with Hierarchical Clustering on Principal Components (HCPC) was executed in R based on a total of 22 categorical variables that assessed household income sources (six variables), expenditure (four variables), household assets (five variables), nature of the family house (four variables), energy source for lighting, energy source for cooking, and source of drinking water (Table 1.) Bootstrapping (i.e., repeated drawing of 100 random samples) was used to generate a mean cluster stability index.
Results
Clustering of households into farm types
Up to 10 dimensions accounted for 57% of the variance in the sampled population (Table 1). Dimension 1 centered on quality of life and wellbeing, while the second dimension was related to investments in agricultural productivity. Together, these two dimensions accounted for 17.5% of the variance in the surveyed communities. Dimension 3 dealt with short-term income security, while 4, 5, and 6 covered long-term food and income security and well-being. These four accounted for 22.3% the variance in the surveyed population. Dimensions 7 to 10, describing the material well being and infrastructure access of farm households beyond farm income and production, amounted to 17.2% of the variance.
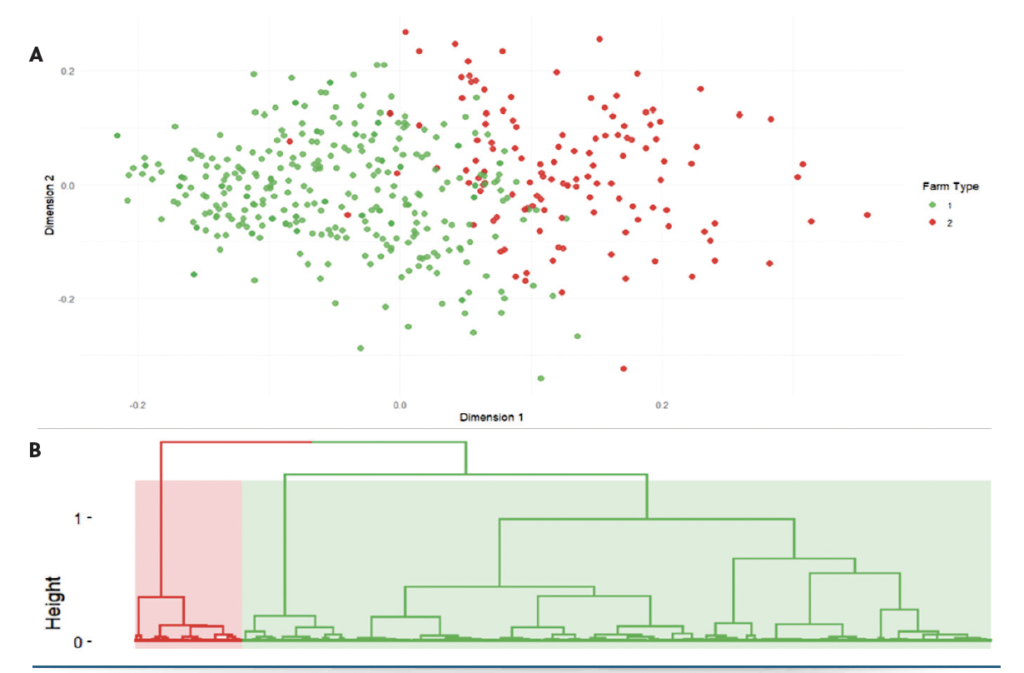
Two clusters were generated (Fig. 2), with very high stability indices of 0.994 and 0.944 for cluster 1 (hereafter referred to as farm type 1) and cluster 2 (hereafter referred to as farm type 2), respectively.
Farm and farmers socio-economic characteristics
Overall, the farm types exhibited significant differences in several key household attributes (Table 2). The findings suggest that the identified farm types are primarily differentiated by education, livelihood diversification, livestock ownership, agricultural investment behavior, healthcare expenditure, and geographical location, while demographic characteristics and coffee farming experience remain broadly similar.
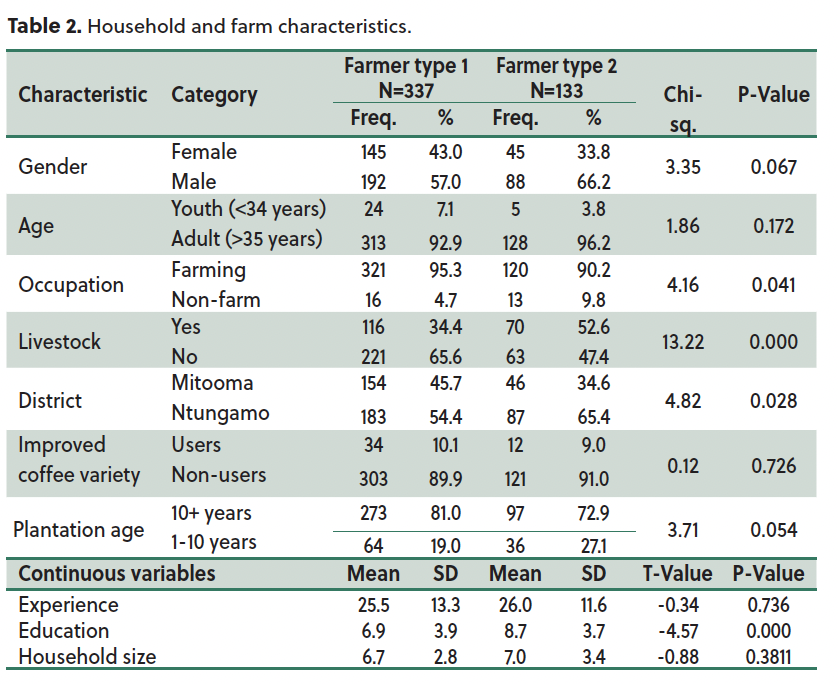
Farm type 2 households were more associated with the Ntungamo District (Chi-sq. = 4.82, p = 0.028), had more years of formal education (8.7 ± 3.7 vs. 6.9 ± 3.9; t = –4.57, p < 0.001), and were more likely to keep livestock than farm type 1 households. Type 1 households were more associated with Mitooma District, and more often cited the association with farming as their primary occupation (95.3% vs. 90.2%; Chi-sq. = 4.16, p = 0.041) and tended to have older coffee plantations (>10 years: 81.0% vs. 72.9%; p = 0.054).
Asset and Resource Endowment
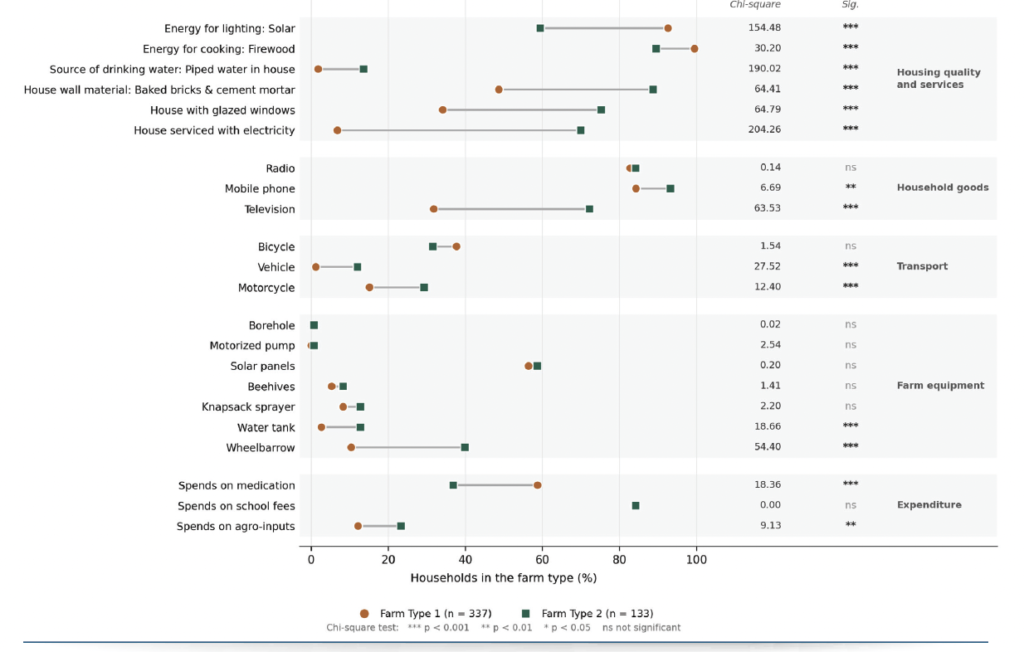
The descriptive analysis reveals pronounced heterogeneity in household welfare and physical asset endowments between the two farm types (see Fig. 3). Across all indicators examined, farm type 2 consistently demonstrated higher access to infrastructure and improved housing conditions, indicating a relatively stronger socioeconomic position than farm type 1. Access to electricity showed the starkest contrast between typologies, with 69.9% of farm type 2 households connected, compared with 6.8% of farm type 1. Housing quality followed a similar pattern: farm type 2 households more often had glazed windows (75% vs. 34%) and permanent construction of baked brick and cement mortar (88.7% vs. 49%), whereas farm type 1 households more commonly occupied timber (38.9% vs. 6.8%) or unbaked-brick, mud-mortar dwellings (12.5% vs. 4.5%). Water infrastructure diverged similarly: farm type 2 households relied mainly on piped water, either outside the dwelling (59.4%) or within the compound (13.5%), whereas farm type 1 households depended primarily on wells (78.6%) and boreholes (11.6%), with only a small minority accessing piped water. Expenditure patterns also diverged, with type 2 households often associated with investing more in agricultural inputs (23.3% vs. 12.2%; Chi-sq. = 9.13, p = 0.003), while type 1 households associated with healthcare expenditure (58.8% vs. 36.8%; Chi-sq. = 18.36, p < 0.001).
Diversification strategies
The Cluster/Modality frequency evaluates the percentage of all farmers with a specific characteristic that is assigned to each cluster or farm type; this is compared against the global frequency which represents the percentage of farmers in the entire dataset that had this characteristic before clustering. The Modality/Cluster frequency evaluates the percentage of farmers in each cluster with a given characteristic (Table 3).
A chi-square test was used to evaluate the association between the resulting clusters and districts. Profiling metrics were generated using the FactoMineR package in R to characterize the clusters and farm types. These included the frequency indices Global, Cluster/Modality, and Modality/Cluster, as well as the formal v-test, where any value greater than 2 was considered statistically significant, and the higher it was, the more unique or defining that variable was for that cluster. The strongest distinguishing characteristics for farm type 1 (Cluster/Modality Frequency > 80%; v-test value > 7 and p-value < 0.0001) were no electricity connection to their houses, dependency on communal well water for drinking, using solar-powered lamps for lighting, no glazed windows in their houses, and timber walls. Farm type 1 households typically use firewood for cooking, have no wheelbarrows, and no income from produce (cereals) but mostly depend on income from coffee. Of the 10% global frequency of reporting income from coffee in the communities surveyed, 94% were farm type 1 households, indicating a strong tendency to depend on coffee rather than annual crops. Approximately 10% of farm type 1 households reported income from trees compared to only 4% for farm type 2 (Table 3). Farm type 1 households are also more likely to have income from banana (9.2%) than their farm type 2 counterparts (1.5%).
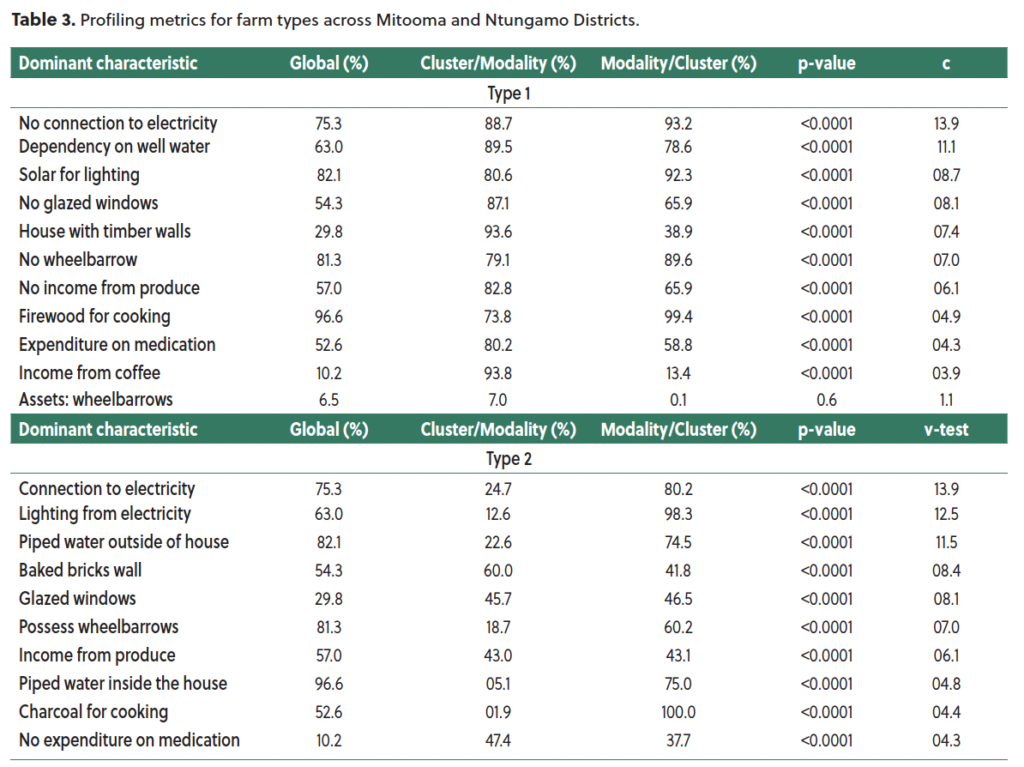
Overall, farm type 1 households are resource-poor and thus tend to stick to low-cost livelihood options and production strategies. However, they exhibit a strong trend toward diversifying their revenue streams beyond coffee to include trees, bananas, and non-farm businesses, unlike their counterparts in farm type 2. Farm type 1 households seem to prefer low-risk investments, mostly long-season crops, as income sources, unlike farm type 2 households, which seem to prefer quick turnover. The low-cost lifestyle chosen by farm type 1 households seems to expose them to affliction by disease, necessitating expenditure on medical treatment at a higher frequency than farm type 2 households (Table 3, Fig. 3).
Income, productivity and technology use
Soil and nutrient management practices
The technology-use characteristics showed a distinction in the soil and nutrient management characteristics. In terms of nutrient management characteristics, farm type 1 were primarily associated with the use of soil organic amendments (78% vs. 64%, Chi-sq. = 8.47, p<0.01) and animal manure (42% vs. 31%, Chi-sq. = 4.30, p<0.05), and although not significant, farm type 2 used more mineral fertilizer than farm type 1. The two farm types were associated with the use of distinctly different erosion and watercontrol structures. Farm type 1 was associated with more terracing structures (46% vs 28%), whereas farm type 2 with trenches (20% vs. 37%). More respondents from farm type 2 were associated with the use of more minimum tillage practices (4% vs. 11%).
Income and productivity
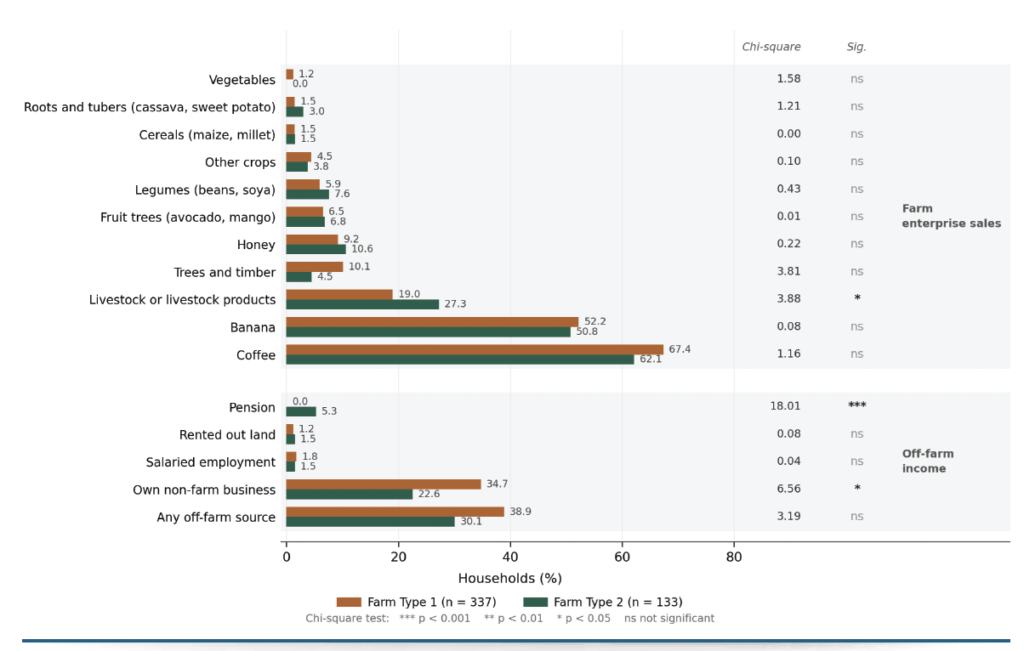
The household incomes reported across the two districts were farm enterprise sales and off-farm income (Fig. 4). Under farm enterprises, the sale of livestock and livestock products was significantly different (19% vs. 27%), where more farmers from farm type 2 were associated with the sale of livestock and livestock products than farm type 1 households (p<0.05). Under non-farm income sources, only farm type 2 households received pensions (0% vs. 5.3%). The ownership of nonfarm businesses was highly associated with farm type 1 than farm type 2.
The total monthly household income was higher for farm type 2 households than for farm type 1 households (Uganda shillings (UGX) 373,925 (USD 100.2) vs. 256,667 (USD 68.9) (p<0.001) (Fig. 5). However, the seasonal revenue from banana was also higher for type 1 households (UGX 616, 659 (USD 165.6) vs. UGX 327,851 (USD 88)). Coffee-banana productivity was not significantly different across farm types.
Discussion
This study partially characterized the baseline situation of the coffee-banana systems in southwestern Uganda. It elaborates on a causal pathway from the farmer endowment status, mapping this to the farm type to indicate diversification patterns and measurement of coffee producers’ performance. This analytical pathway provides a more holistic understanding of the farmer baseline context. It establishes the pre-project intervention conditions of the coffee-banana production systems and offers critical guidance for the effective design and implementation of the Uganda Coffee Carbon Project.
The study sample consisted of older coffee–banana producers with extensive farming experience, managing coffee plantations that were over 25 and 10 years old, respectively. These plantations typically do not employ improved coffee varieties and inorganic inputs.
The cluster analysis identified two distinct categories of farmers based on geographical location, landscape characteristics, and resource endowment. Both categories engage in diversification; however, their risk management strategies differ. The diversification strategies among the clusters vary in terms of crop mix, livestock integration, off-farm income, and enterprise composition. The first category comprises farming-dependent coffee producers from Mitooma, while the second includes resource-endowed, non-coffee-dependent farmers from Ntungamo. The latter group exhibits higher and more diversified incomes and income sources, including livestock, livestock products, and pensions. They possess higher levels of education, greater asset endowment, superior housing, and better access to infrastructure. These farmers demonstrate greater risk tolerance, choosing to cultivate annual crops such as legumes (beans and soybeans) and are more inclined to use agro inputs. In contrast, the coffee-dependent farmers from Ntungamo exhibit more risk-averse production systems, cultivating perennial crops within coffee-banana systems, including trees, and owning non-farm businesses. Notably, coffee-dependent farmers achieve significantly higher seasonal income from banana sales compared to resource-endowed farmers. The distinction in the farmer outcomes and performance (i.e. productivity, income, income sources and technology use) is not as prevalent as the farm type and diversification distinction possibly due to drought, poor agronomic practices, etc. The association of farm type 2 with trenches (Ntungamo) and the association of farm type 1 with terracing (Mitooma) could be landscape-based soil and water conservation practices that are influenced by terrain. Nevertheless, the distinction in the use of organic materials by farm type provides an indication of the potential for the nutrient management approaches.
Implications for coffee system development and UCCP implementation
Targeted strategies for coffee farmers can facilitate income diversification and mitigate financial risk. This study provides several insights:
1. Developing strategies to enhance yield stability and resilience under variable weather conditions is essential. We provide evidence for customizing 4R/nutrient recommendations to accommodate real farm heterogeneities. Applying a “one-size-fits-all” 4R approach to diverse farm types overlooks critical differences in resource endowment, livelihood orientation, and investment capacity, thereby supporting the development of site-specific precision agricultural decision-support systems. On-farm experimentation (OFE) could facilitate the evaluation of 4R nutrient solutions necessary for the two farm types to achieve improved productivity, income growth, and sustainability through the adoption of multiple benefit plant nutrition strategies. For instance, coffee-dependent households could benefit from focusing on 4R nutrient solutions tailored to coffee–banana systems. Enhancing the nutrition of coffee plants contributes to income diversification and resilience, underscoring the significance of coffee nutrition and the susceptibility of coffee-dependent households to price fluctuations and climate risks. These households cultivate indigenous trees within agroforestry systems, offering an additional safety net and the potential to benefit from carbon markets. For the resource endowed risk tolerant farm types, 4R nutrient solutions could be designed for cereal-legume systems to better serve resource-endowed farmers cultivating annual crops, including pulses to support legume driven intensification.
2. The analysis offers a practical segmentation tool for extension services, enabling the development of distinct messages, input bundles, and financing options for each farm type. For example, low-cost plant nutrition upgrades for coffee-dependent smallholders, more market-oriented packages, and integrated crop–livestock nutrient cycling for asset-rich households.
3. The empirical foundation of this study supports business development models (e.g., credit/insurance for asset-poor, coffee-dependent households; market linkage support infrastructure for livestock-oriented farms) to scale plant nutrition strategies and provides evidence to advocate for differential policies.
Conclusion
The endowment-farmer type-diversification farmer performance aspects of a novel conceptual framework are examined to provide comparative details across typologies. Although the sample revealed distinct farm types and diversification strategies, these differences did not translate into a distinct causal pathway on farmer performance. Farm types were mostly not significantly distinct in their variations in productivity, income, or technology use. An in-depth (econometric) analysis is required to refine the understanding of farm types and enhance endline analysis to provide insights into household evolution, validation, and technology adoption specific to each type.
Acknowledgement
This project is funded by the APNI and OCP Foundation and implemented in partnership with the Ankole Coffee Producers Cooperative Union (ACPCU), Mohammed VI Polytechnic University (UM6P), Environmental Conservation of Trust of Uganda, ECOTRUST, Makerere University, Producers Direct, and OCP Foundation. Written informed consent was obtained from all participants before data collection. Participants were informed of the purpose of the study, the voluntary nature of participation, their right to withdraw at any time without penalty, and the measures taken to ensure confidentiality of their responses.
Dr. Pali (e-mail: p.pali@apni.net) is Senior Scientist, APNI, Nairobi, Kenya. Ms. Limo is Research Assistant, APNI, Nairobi. Dr. Taulya is Soil Scientist, Makerere University, Uganda. Dr. Adolwa is Scientist, APNI, Nairobi. Mr. Komwangi is Projects Manager, Ankole Coffee Producers Cooperative Union (ACPCU), Uganda. Dr. Oberthür is Business & Partnerships Director, APNI, Benguérir, Morocco. Mr. Natushemba is Centre for Excellence Manager, Producers Direct, Uganda. Mr. Webb is Head of Information, Producers Direct, UK. Mr. Lahamdi is International Program Lead, OCP foundation, Rabat, Morocco. Mr. Bamuhangaine is the Certifications & Extension Supervisor Manager at ACPCU, Uganda & UK. Dr. Mutegi is R&D Deputy Director, APNI, Nairobi.
Cite this article
Pali, P., Limo, B., Taulya, G., Adolwa, I., Komwangi, D., Oberthür, T., Natushemba, A., Webb, S., Lahamdi, S.E., Bamuhangaine, N., Mutegi, J. 2026. Decoding Ankole’s Coffee Landscape: Farmer Typologies and Livelihood Strategies from the Uganda Coffee–Banana System. Growing Africa 5(1): 24-33. https://doi.org/10.55693/GA51.KICC6534
REFERENCES
Alvarez, S., et al. 2018. Capturing farm diversity with hypothesis-based typologies: An innovative methodological framework for farming system typology development. PLOS ONE 13(5), Art.e0194757.
Apanovich, N., Nyairo, R. 2025. Dominant smallholder farming system typologies in South-Central Uganda and their food security status. Agriculture & Food Security 14(1), Art. 17.
Davis, A.P., et al. 2023. A review of the indigenous coffee resources of Uganda and their potential for coffee sector sustainability and development. Fron. in Plant Sci. 13, Art. 1057317.
De Bauw, P., et al. 2016. Soil fertility gradients and production constraints for coffee and banana on volcanic mountain slopes in the East African Rift: A case study of Mt. Elgon. Agric., Ecosys. & Env. 231:166-175.
FAO. 2026. FAOSTAT: Crops and livestock products – Coffee, green; Uganda (area harvested and yield), 1961–2023 [Data set].
Huber, R., et al. 2024. Farm typologies for understanding farm systems and improving agricultural policies. Agric. Sys. 213, Art. 103800.
ICO & UCDA. 2022. Uganda country coffee profile. https://ugandacoffee.go.ug/sites/default/files/2022-03/Uganda%20Country%20Coffee%20Profile_1.pdf
Jassogne, L., et al. 2013. Coffee/banana intercropping as an opportunity for smallholder coffee farmers in Uganda, Rwanda, and Burundi. In G. Blomme, et al. (eds.), banana systems in the humid highlands of sub-Saharan Africa (pp. 144-149). CABI.
Kiwuka, C., et al. 2021. Genetic diversity of native and cultivated Ugandan Robusta coffee (Coffea canephora Pierre ex A. Froehner): Climate influences, breeding potential and diversity conservation. PLOS ONE 16(2), Art. e0245965.
Landais, E. 1998. Modelling farm diversity: New approaches to typology building in France. Agric. Sys. 58(4):505-527.
Mpiira, S., et al. 2023. Farm diversification benefits and technology choice: A case study of the coffee-banana farming system in Central Uganda. African J. Agric. Res. 19(1):48-60.
Mukasa, D., et al. 2025. A stepwise approach to facilitate adoption of climate smart practices for smallholder coffee production in Uganda. Int. J. Agric. Sus. 23(1), Art. 2513790.
Mulinde, C., et al. 2025. Climate patterns and extremes in Uganda’s Arabica and Robusta coffee regions. African Geographical Review, 1-23.
Poncet, V., et al. 2024. Which diversification trajectories make coffee farming sustainable? Cur. Opin. Env. Sus. 68, Art.101432.
Van Asten, P.J.A., et al. 2011. Agronomic and economic benefits of coffee–banana intercropping in the Arabica and Robusta growing regions of Uganda. Agric. Sys. 104(4):326-334.