By Luis I. Prochnow and Artur Lupinetti-Cunha
Researchers have produced a comprehensive map of soil P bioavailability for Africa’s commercial crops showing that almost the entirety of the continent’s agricultural soils can be expected to have an economic response to the application of P fertilizer.
Phosphorus (P) is an essential nutrient for plant development and plant-based food production. Based on the amounts commonly needed per hectare, P is necessarily classified as a macronutrient along with nitrogen (N), potassium (K), calcium (Ca), magnesium (Mg), and sulfur (S). The amount of P needed to achieve a high level of agricultural productivity is soil and crop specific. However, most of the world’s agricultural soils are unable to supply adequate amounts of P to meet the needs of high yielding crops. The addition of P to soils is critical to produce the food, feed, fiber, and bioenergy the world requires.
In order to define the correct rate of P to apply, one must first evaluate the status of soil P bioavailability. This can be achieved by different techniques, soil chemical analysis being the most common, relying on years of agronomic studies of: 1) correlation, which defines the best soil testing methodology in the region, 2) calibration, which classifies results according to the nutrient bioavailability (e.g., very low, low, medium, high, and very high), and 3) response curve development that defines the ideal, crop specific rate of P to be applied according to soil P status and yield goals. Regions not having the basic research steps above usually rely on other studies elsewhere to define their fertilizer application programs.
Africa is a new frontier of agricultural development and accessing general information for nutrient status of African soils is crucial for guiding investments to increase continental food production. Considering this, our objectives were to produce a comprehensive map of soil P bioavailability for Africa’s commercial crops based on the best dataset presently available, and to compare this status with other regions having similar information.
Mapping soil P bioavailability is important, not just at field scale to recommend fertilizer application rates, but also at larger scales to inform soil and fertilizer policies and investments, agronomic advice, and ultimately, to close crop yield gaps.
A continental map of soil P status
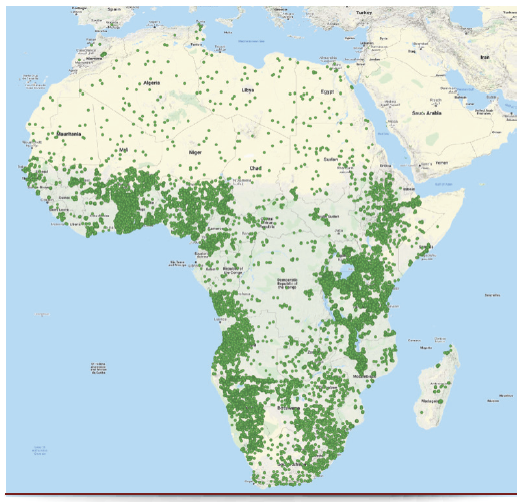
To capitalize on an increasing quantity of soil samples being collected by various government and/or NGO funded projects, iSDA produced detailed 30 m resolution maps for soil nutrients, including a map for soil P at the 0 to 20 cm depth [Hengl et al. (2021); https://www.isda-africa. com/isdasoil]. These maps were developed using a two-scale Ensemble Machine Learning framework implemented from the Machine Learning in R (MLR) package. The study also used coarse covariate layers of 250 m resolution (MODIS, PROBA-V and SM2RAIN products) and 30 m resolution (Sentinel-2, Landsat and DTM derivatives) images. Some important soil samples datasets included: 1) AfSIS I and II soil samples for Tanzania, Uganda, Nigeria, Ghana with ~40,000 sampling locations (Vågen et al. 2020); 2) ISRIC Africa Soil Profile Database with 13,000 legacy profiles collected across Africa and collated by ISRIC as part of the AfSIS project; 3) LandPKS with ~12,000 soil profile observations, crowd-sourced and collected via the LandPKS mobile app; 4) IFDC with 9,000 soil sampling locations across Ghana, Uganda, Rwanda, and Burundi collected from various projects; and 5) AfricaRice and the Taking Maize Agronomy to Scale in Africa (TAMASA) project with more than 3,000 soil sampling locations across Africa generated from on-farm trials.
The soil sampling points collectively used in the iSDA soil P map are illustrated in Fig. 1. In total 53,493 soil analysis results using the Mehlich-3 soil testing methodology (Mehlich, 1984) were considered for creating the map. Mehlich-3 is a widely used procedure for evaluating P bioavailability in soils across the world. The method consists of the extraction of P from the soil samples by adding a weak acid that has the advantage of being applicable for several elements [i.e., P, Ca, Mg, K, copper (Cu), zinc (Zn), manganese (Mn), and iron (Fe)]. Mehlich-3 is well correlated with plant P uptake and is therefore considered a standard method for plant available soil P determination.
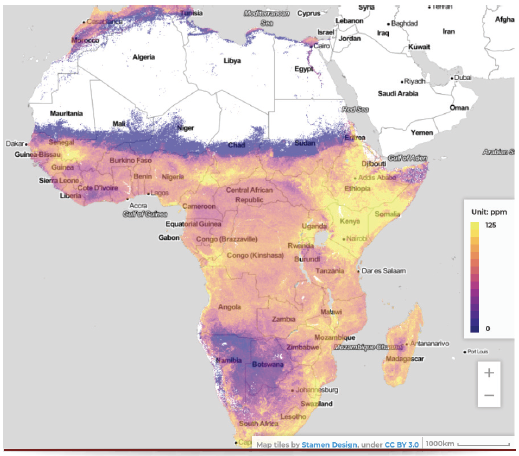
iSDA’s final map for plant available P (Fig. 2) adopted a range scale of 0 to 125 mg P kg-1, however this range has no clear connection to plant P bioavailability. Interpretations for soil tests based on thresholds linked to plant response to P vary according to the methodology and between soil types and must be preferably defined by calibration studies at the local level. However, these basic studies have not been conducted extensively for soils in Africa.
A revised map based on bioavailable P thresholds
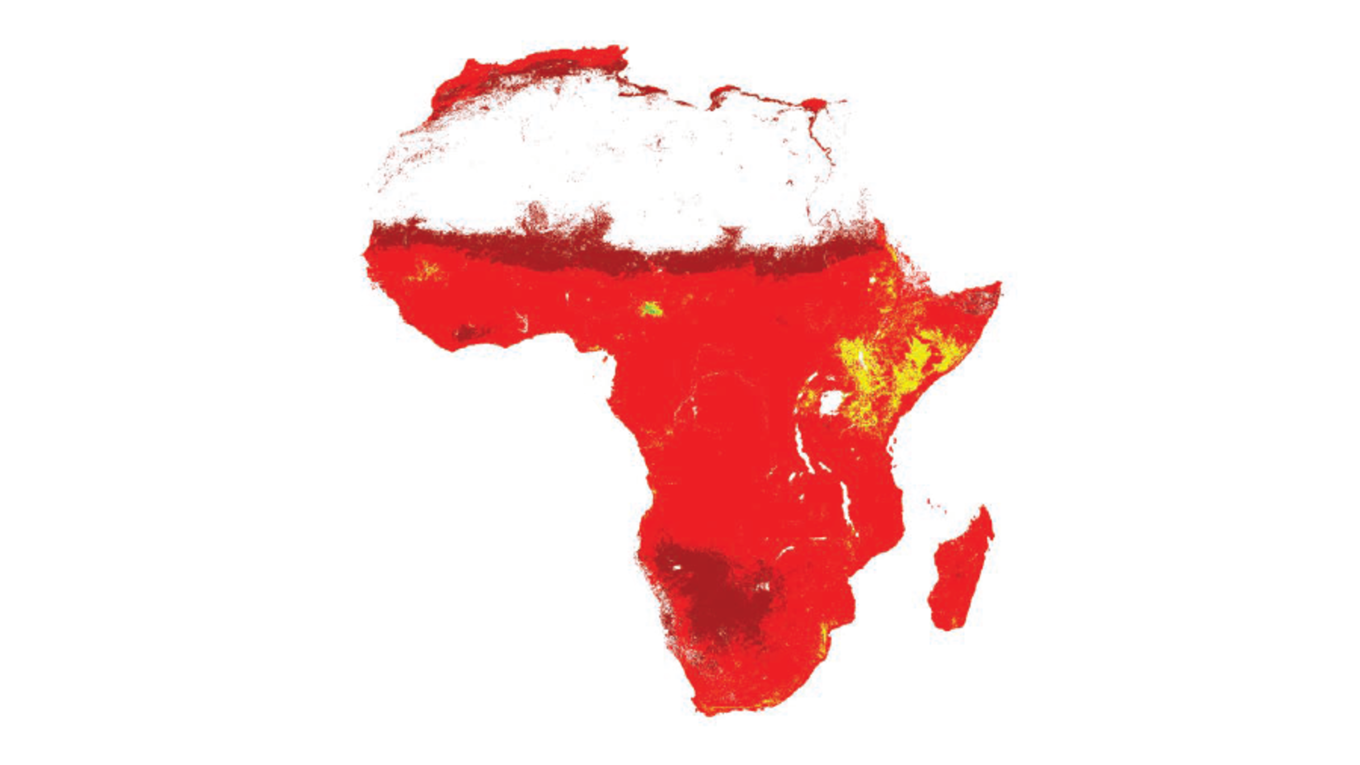
The dataset used to create a revised version of the map was extracted from the original iSDA website data. This revision assumes Mehlich-3 thresholds [i.e., in mg P kg-1 very low = 0 to 5.0 (dark red); low = 5.1 to 15 (light red); medium = 15.1 to 30 (yellow); high = 30.1 to 60 (light green); and very high ≥ 60.1 (dark green)] described in the methodology and based on several different interpretations
from laboratories and soils across the world. In general terms, it is assumed that the different classes of soil P bioavailability correspond to the probability of observing a response to the application of P fertilizer. Thus, the original data from iSDA was back transformed to produce a new map using thresholds recognized to reflect plant P bioavailability.
The resulting map (Fig. 3) shows a clear predominance of areas with low and very low bioavailable soil P in Africa. Statistics indicate 17.91%, 78.06% and 3.99% of soils have very low, low and medium amounts of Mehlich-3 bioavailable soil P, respectively (Table 1). Assuming that the relative yields in each of these three respective ranges would be 0 to 50%, 51 to 70% and 71 to 90% (Havlin et al., 2005), this study predicts that 99.97% of African soils would respond to P fertilization, which is remarkable if compared to other regions of the world.
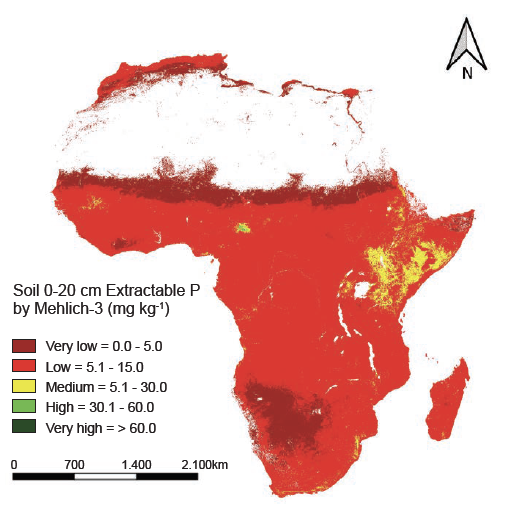
Thresholds used to classify soil P status by Mehlich-3 do differ among regions. Some use narrower thresholds, for example 0 to 5, 5.1 to 10, 10.1 to 15, 15.1 to 30, and > 30 mg P kg-1 for very low, low, medium, high, and very high soil P, respectively. If this classification were to be adopted for our map, still 96% of the soil samples would be classified as P responsive.
In comparison, Ballabio et al. (2019) mapped soil chemical property datasets by interpolating 22,000 surveyed points covering the 26 European Union Member States using the LUCAS topsoil database and advanced digital soil mapping methodologies based on three classes of bioavailable P (mg kg-1) including low = 0 to 25, medium = 25 to 50, and high > 50 (Fig. 4). Results clearly show a much lower frequency of soils low in P compared with Africa, and consequently, a smaller area expected to respond to fertilizer P. A similar trend is observed in the studies of Yu et al. (2021) for China (Fig. 4), Murrell et al. (2015) for the U.S., and Prochnow et al. (2018) for a portion of Brazil. The reasons for the much lower P bioavailability in Africa compared to other regions of the world are the predominance of Africa’s highly weathered tropical soils and a chronically low reliance on P inputs.
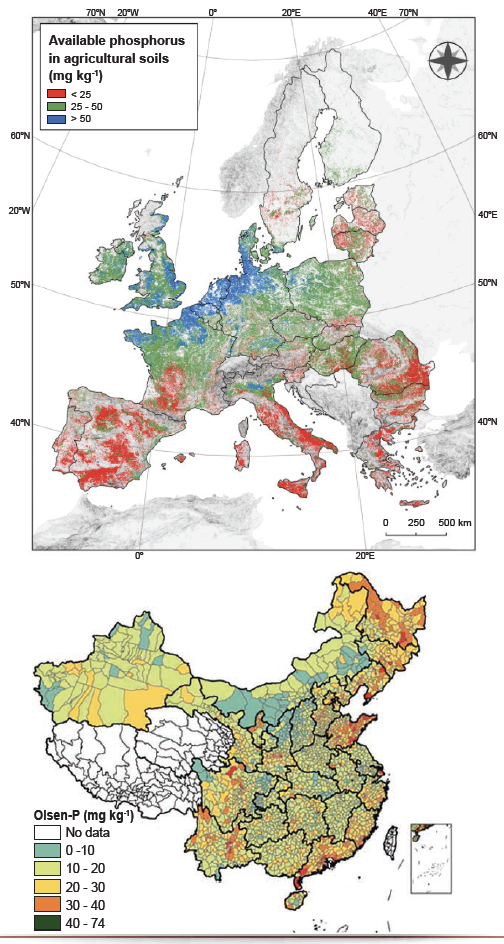
Figure 4. Bioavailable P in agricultural soils of the EU and UK (top) and China (bottom). Sources: Ballabio et al., 2019; Yu et al., 2021
It is important to note that some of these studies produced maps using soil testing methodologies other than Mehlich-3. Regardless, map interpretation should consider the sufficiency levels adapted to each methodology and region, and one should avoid using conversion factors amongst methodologies.
Summary
The map of Mehlich-3 bioavailable P for soils of Africa clearly demonstrates, based on the best dataset presently known, that the continent’s agricultural soils are extremely low in P fertility, and that in the future it will be necessary to increase soil bioavailable P through P fertilizers in order to produce the amounts of food, feed, fiber and bioenergy the continent will desperately need. n
Dr. Prochnow is a Specialist in Soil Fertility, Fertilizers and Plant Nutrition, Researcher at Plant Nutrition Science & Technology, Piracicaba, São Paulo, Brazil, and Consultant for the Global Phosphorus Institute, Morocco. e-mail: Lprochnow@ npct.com.br. Mr. Lupinetti-Cunha is with the Department of Ecology, Biosciences Institute, University of São Paulo, Brazil.
Acknowledgement
The authors acknowledge permissions granted from iSDA for the use of their data for this study. This work was done under a consultancy agreement between the author and the Global Phosphorus Institute (GPI).
Cite this article
Prochnow, L.I. and Lupinett-Cunha, A. 2022. Building a Map of Biovailable Phosphorus for African Soils, Growing Africa 1(2), 32-35. https://doi.org/10.55693/ga12.BNYE1358
REFERENCES
Ballabio, C. et al. 2019. Mapping LUCAS topsoil chemical properties at European scale using Gaussian process regression. Geoderma, 355:113912.
Havlin, J.L. et al. 2005. Soil fertility and fertilizers: an introduction to nutrient management, 7th edition. Pearson Prentice Hall, 515p.
Hengl, T. et al. 2021. African soil properties and nutrients mapped at 30 m spatial resolution using two-scale ensemble machine learning. Sci. Rep. 11, 6130.
Mehlich, A. 1984. Mehlich 3 Soil Test Extractant. A Modification of the Mehlich 2 Extractant. Comm. Soil Sci. Plant Analy., 15, 1409-1416.
Murrell, T.S. et al. 2015. The fertility of north American soils: a preliminary look at 2015 results. Better Crops with Plant Food 99:28-31.
Prochnow, L.I. et al. 2018. Soil fertility survey for the state of São Paulo, Brazil. Informações Agronômicas, 161:1-18.
Vågen, T.-G. et al. 2020.Mid-Infrared Spectra (MIRS) from ICRAF Soil and Plant Spectroscopy Laboratory: Africa Soil Information Service (AfSIS) Phase I 2009- 2013. World Agroforestry (ICRAF).
Yu, W. et al. 2021. Estimation of the P Fertilizer Demand of China Using the LePA Model. Frontiers in Env. Sci., 9:1-12.